MANDATE
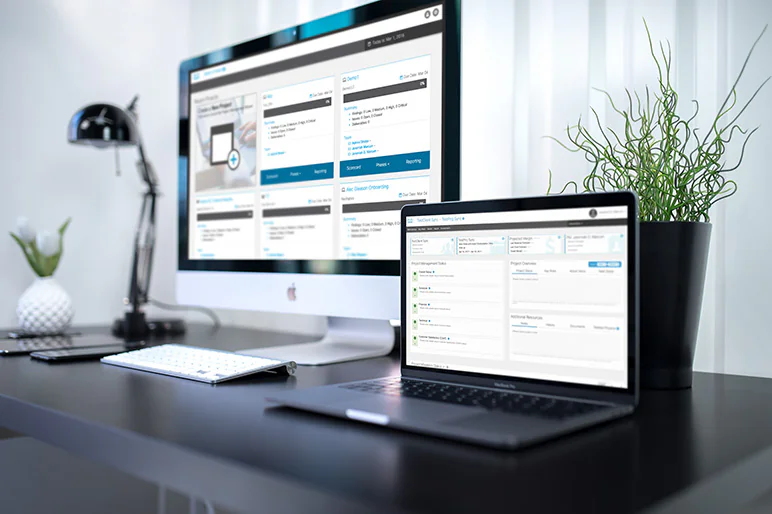
Help the combined consulting teams scope, deliver and report engagements through one usable application.
BASELINE
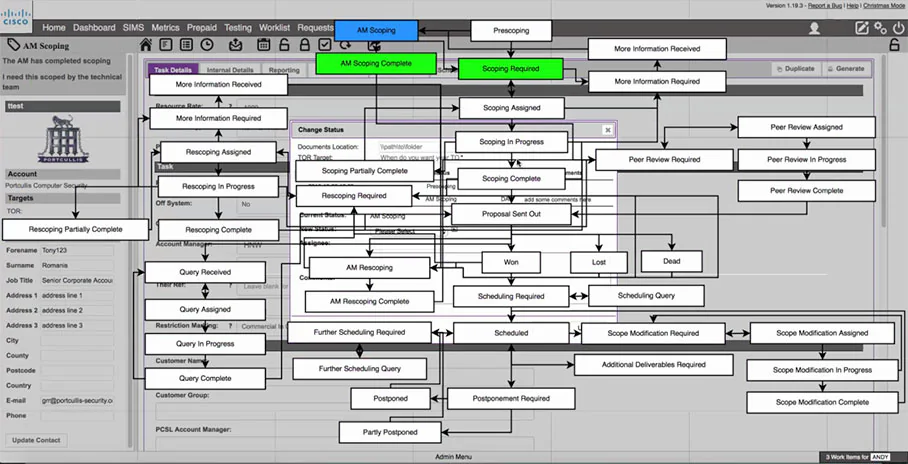
A shared model of 40+ statuses, with side spreadsheets and repeated entry of scanner findings.
MY RESPONSIBILITY
I led research, information architecture, interaction design, prototype validation and the front-end build.
PRINCIPAL CONSTRAINT
Preserve legacy engagement data and support consultants working on live client projects throughout the transition.
RESULT
Views organized by role, a Findings Merge workflow with four steps and implemented delivery, reporting and requirements screens.
The context
Preserve the business workflow. Make the next action easier to find.
The acquired application had accumulated more than 40 workflow statuses. Account managers, analysts and consultants needed different information, but worked through a dense shared model. I needed to make each role’s responsibilities and handoffs clear while retaining historical engagements and supporting active client work.
THE OPERATING CONSTRAINTS
Two organizationsUK and US management teams with different habits and priorities
Legacy dataYears of engagements that had to survive the move intact
ConfidentialityClient vulnerability findings that could not leave controlled systems
Live deliveryConsultants billing on active projects throughout the transition
Research and synthesis
Understand the workarounds before changing the workflow.
I interviewed consultants at the whiteboard and worked with UK and US management teams to understand the engagement lifecycle. We mapped decisions and handoffs, revealing side spreadsheets, repeated entry of findings and status updates made after the work. Those observations shaped the information architecture and the tasks I prioritized.
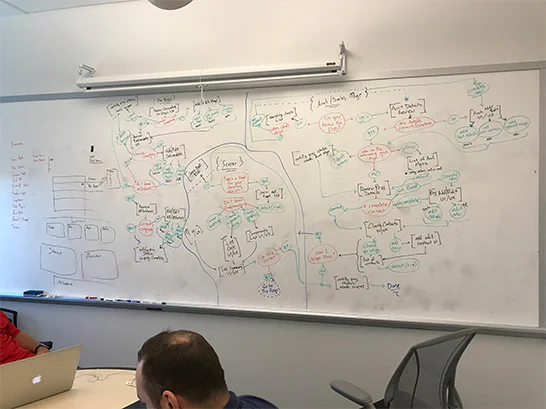
User interview sessions
Consultants walked through a live engagement while we mapped each decision and handoff.
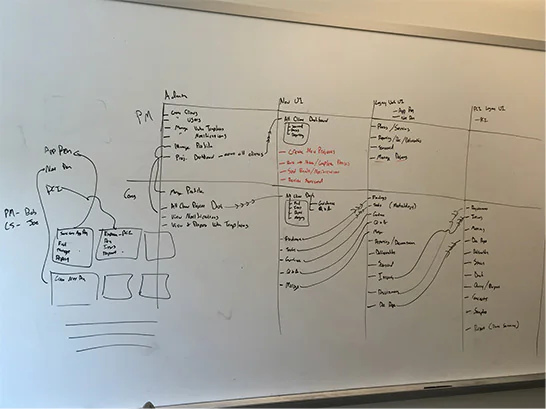
Internal strategy session
Roles, permissions, and the new information architecture, agreed with both leadership teams.
Turn observed needs into testable scenarios.
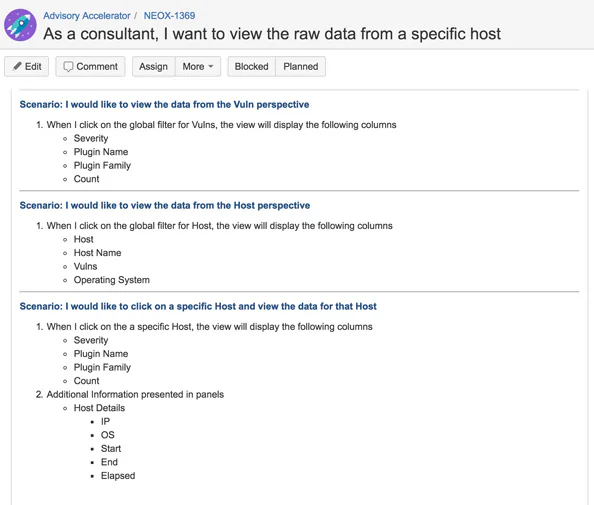
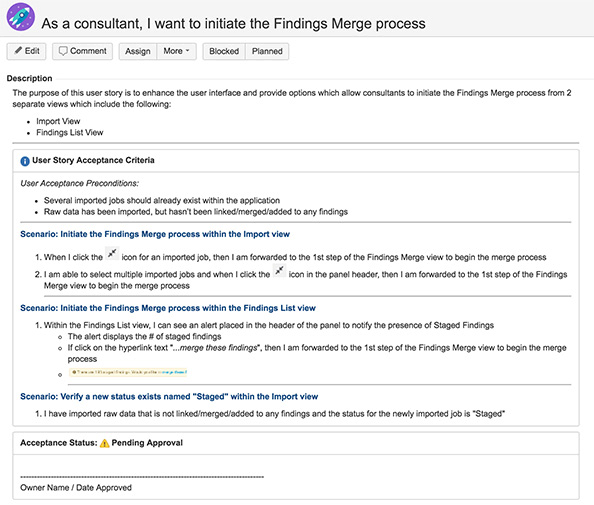
I translated research findings into Jira stories from the consultant’s perspective, with acceptance criteria that testers from both teams could verify. This connected the design rationale to expected behavior during implementation.
UX exploration
Views organized by role over 40+ legacy statuses
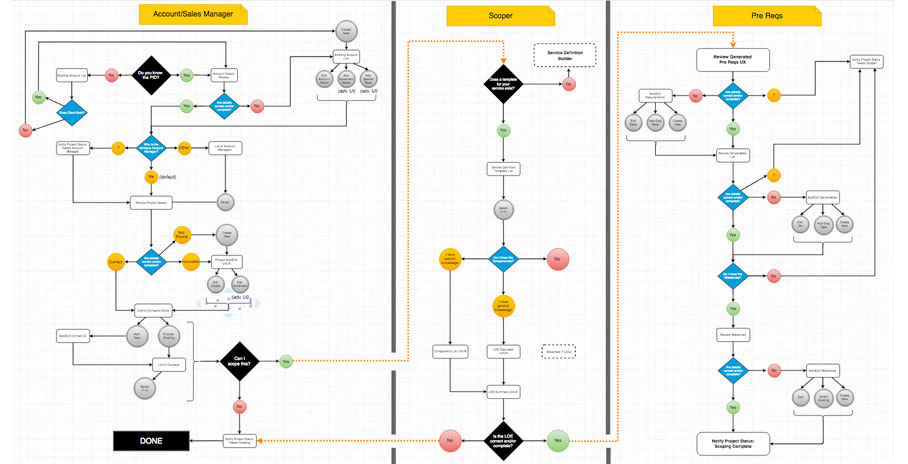
I organized the experience around the account manager, analyst and consultant. Instead of asking everyone to interpret the full status model, each view focused on the work that role needed to complete and the handoff that followed. The underlying engagement data stayed intact.
01 · IDEATION
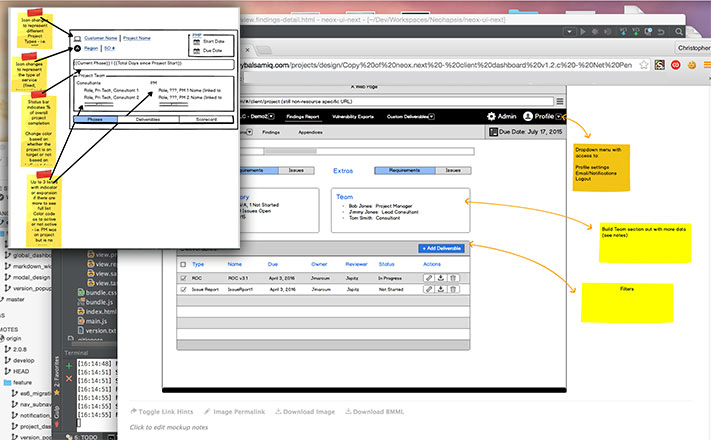
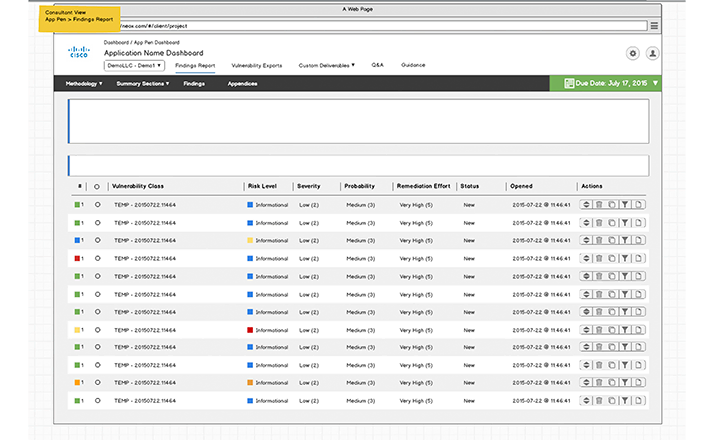
I used annotated wireframes to explore information hierarchy and interactions against the existing application’s technical constraints.
02 · VALIDATION
I tested prototypes of the consultant view before visual design, using the workflow to evaluate whether the proposed structure supported their tasks.
Signature workflow
Guide the merge. Keep consultants in control of the finding.
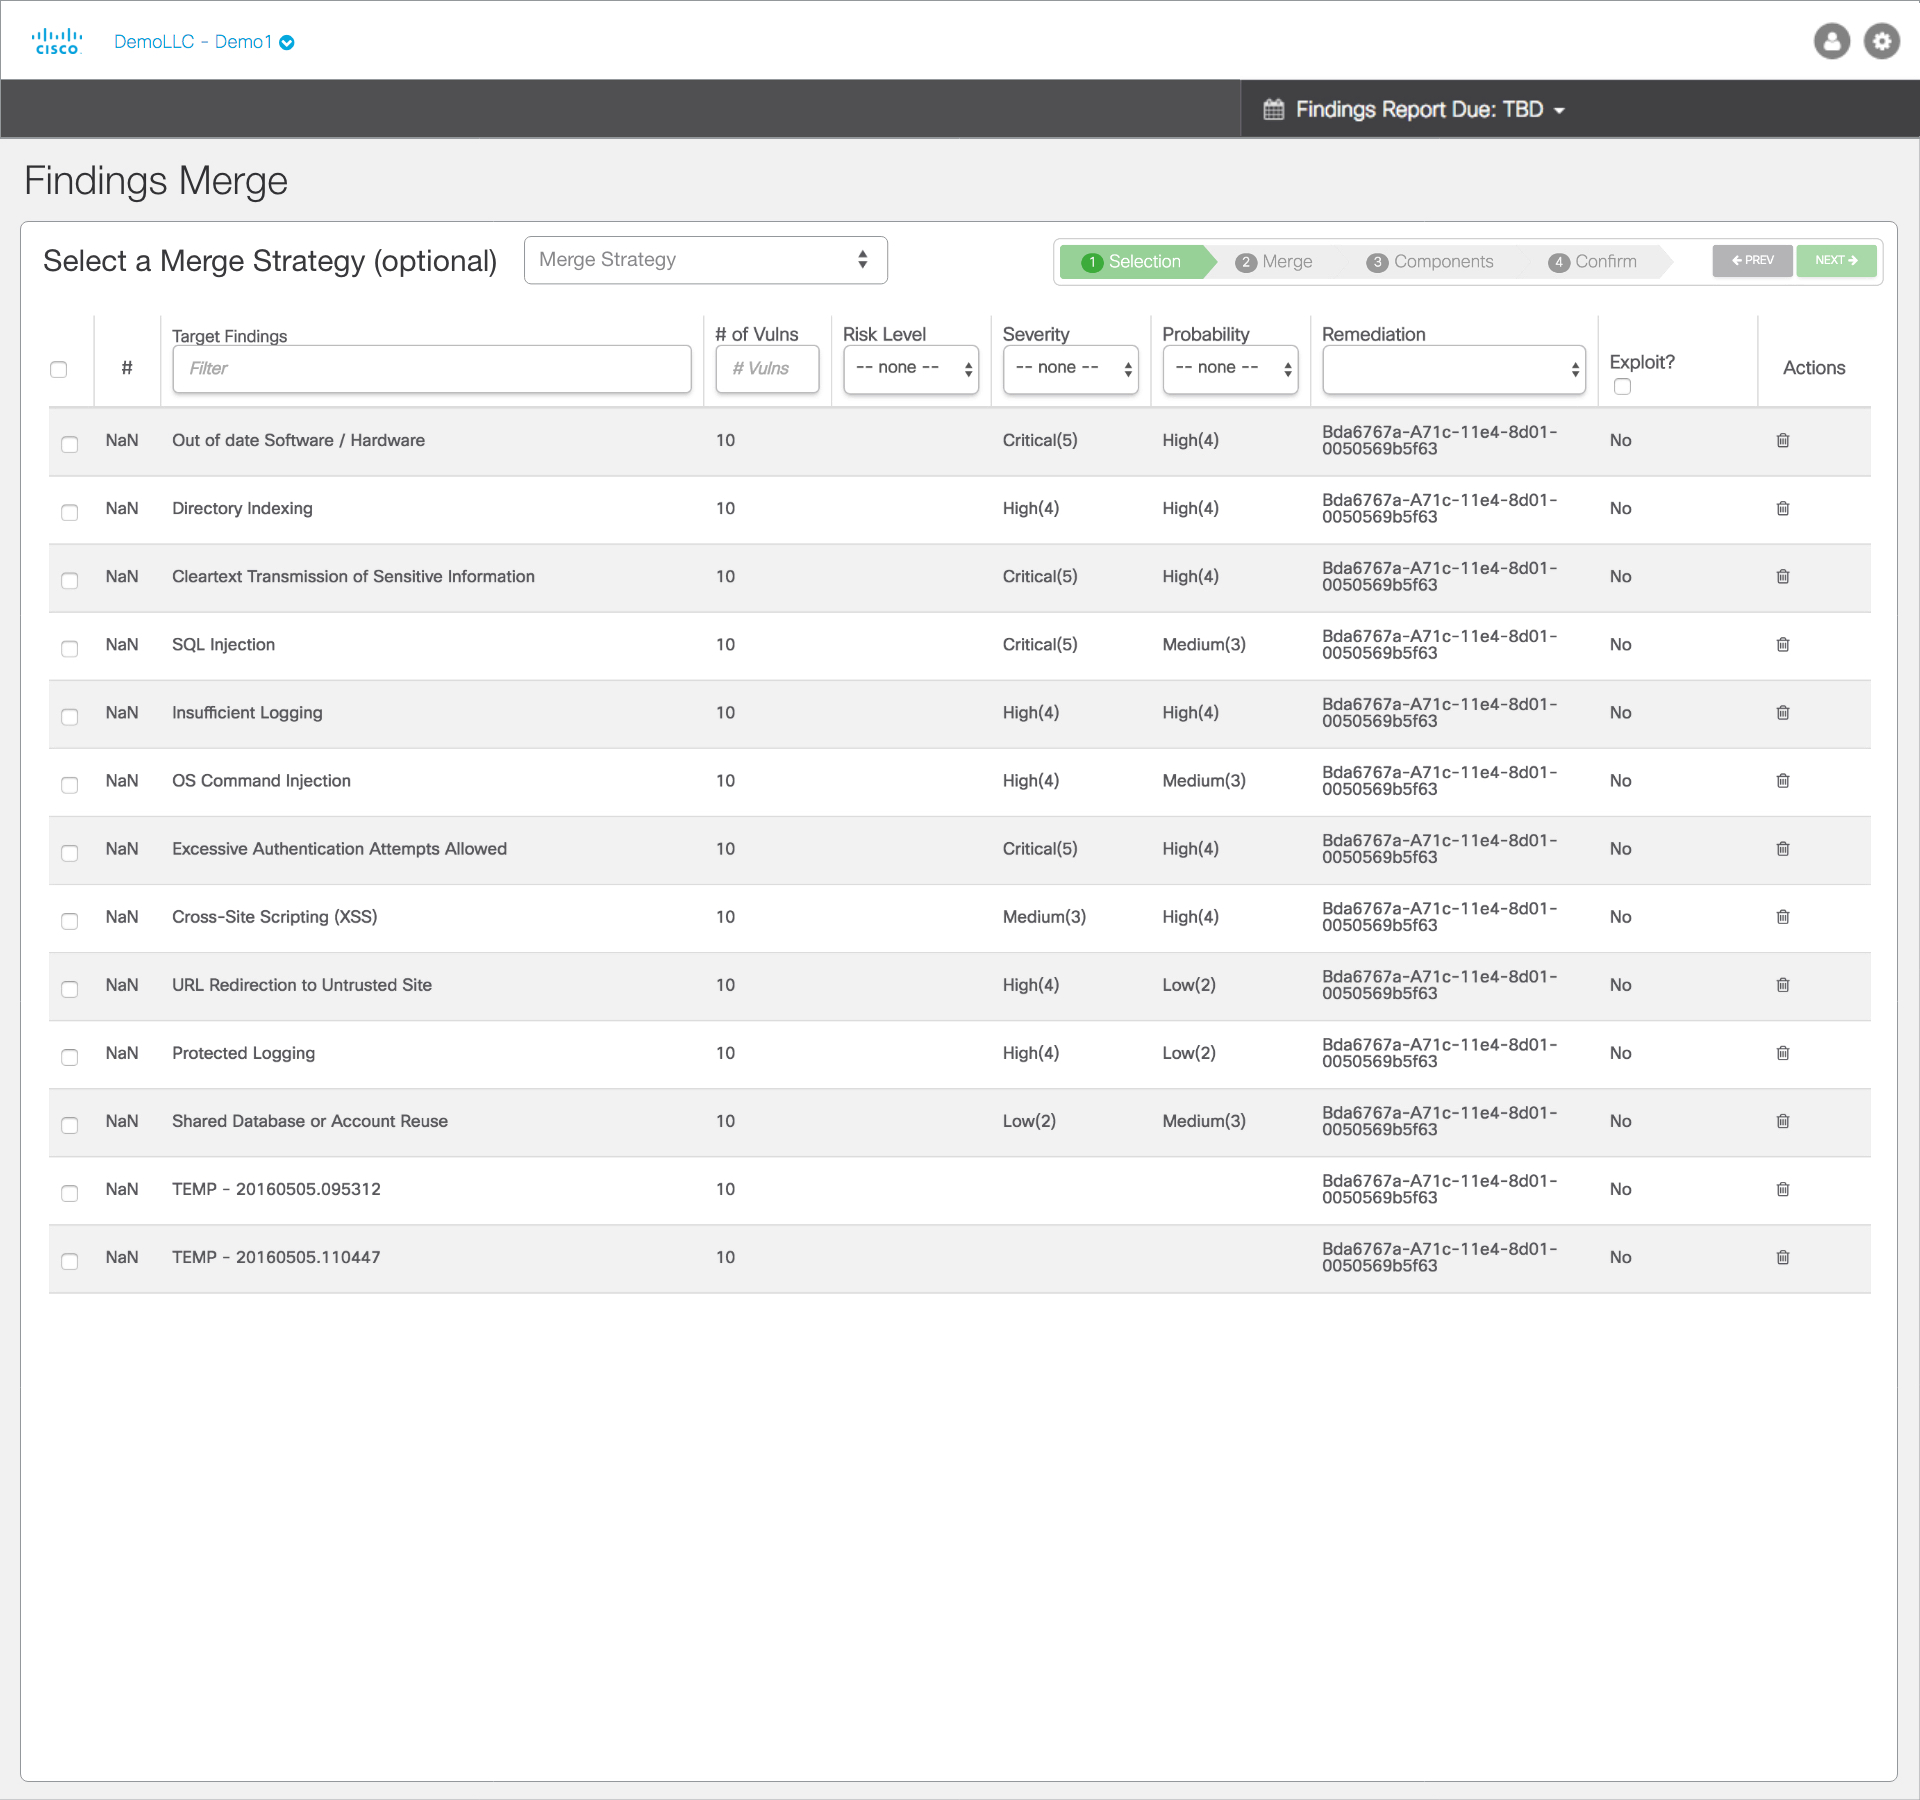
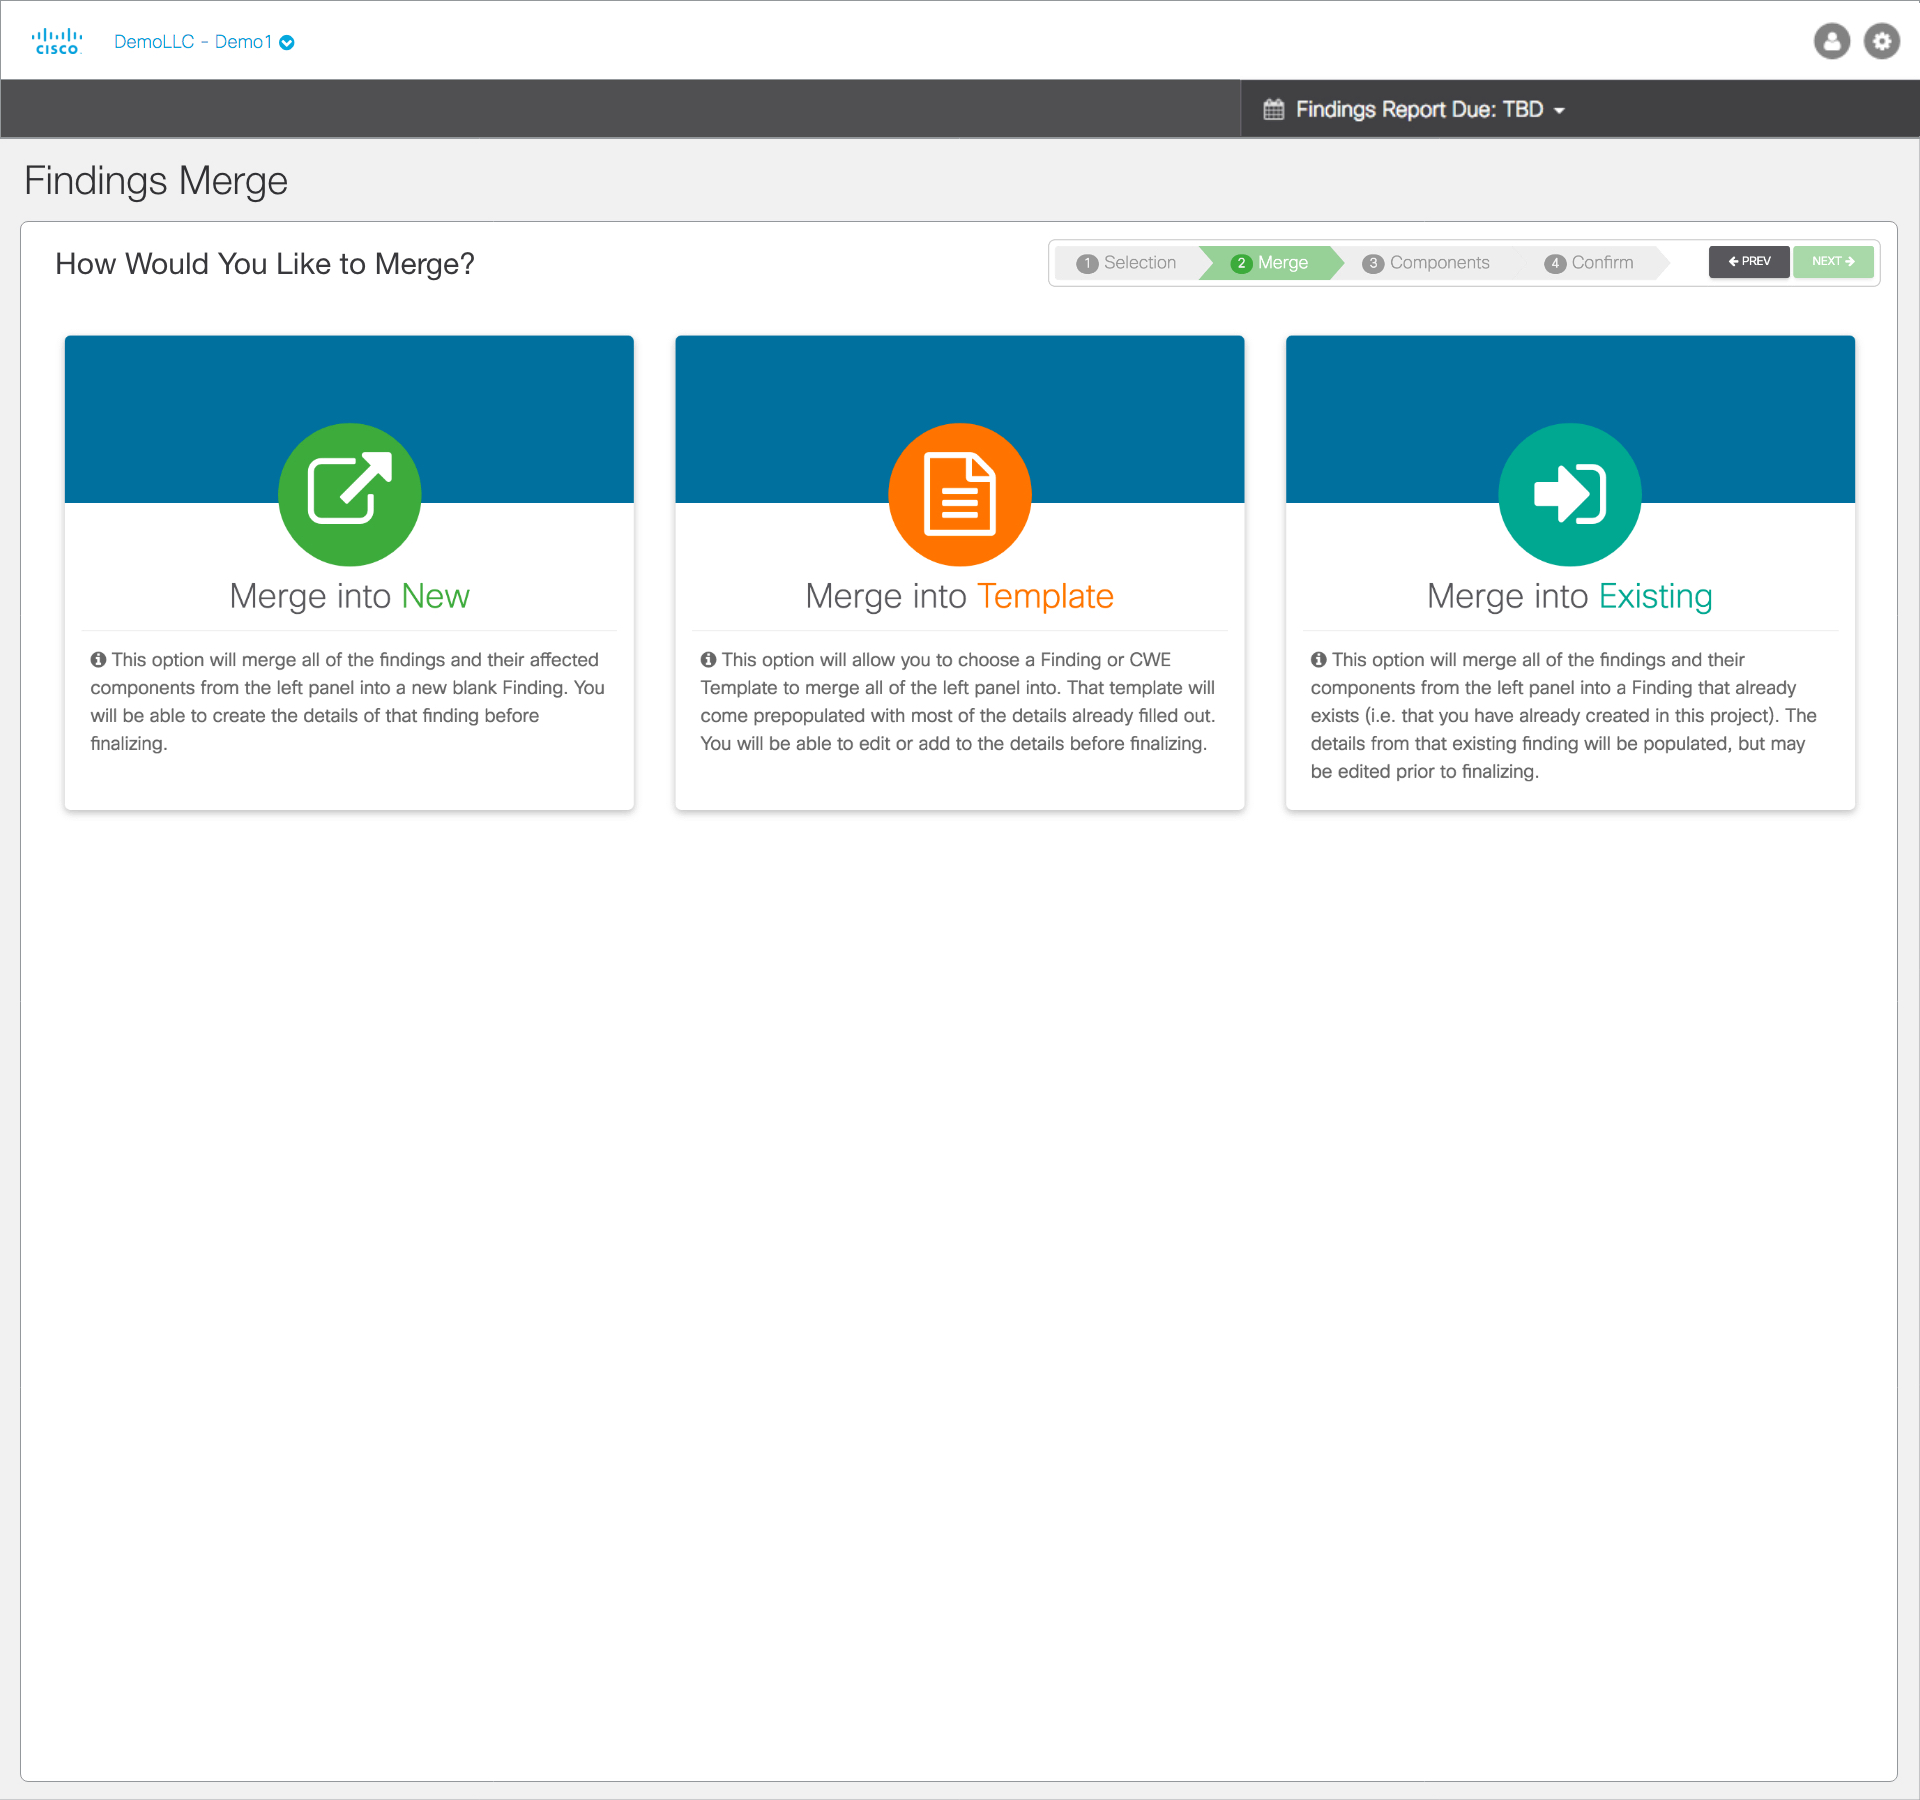
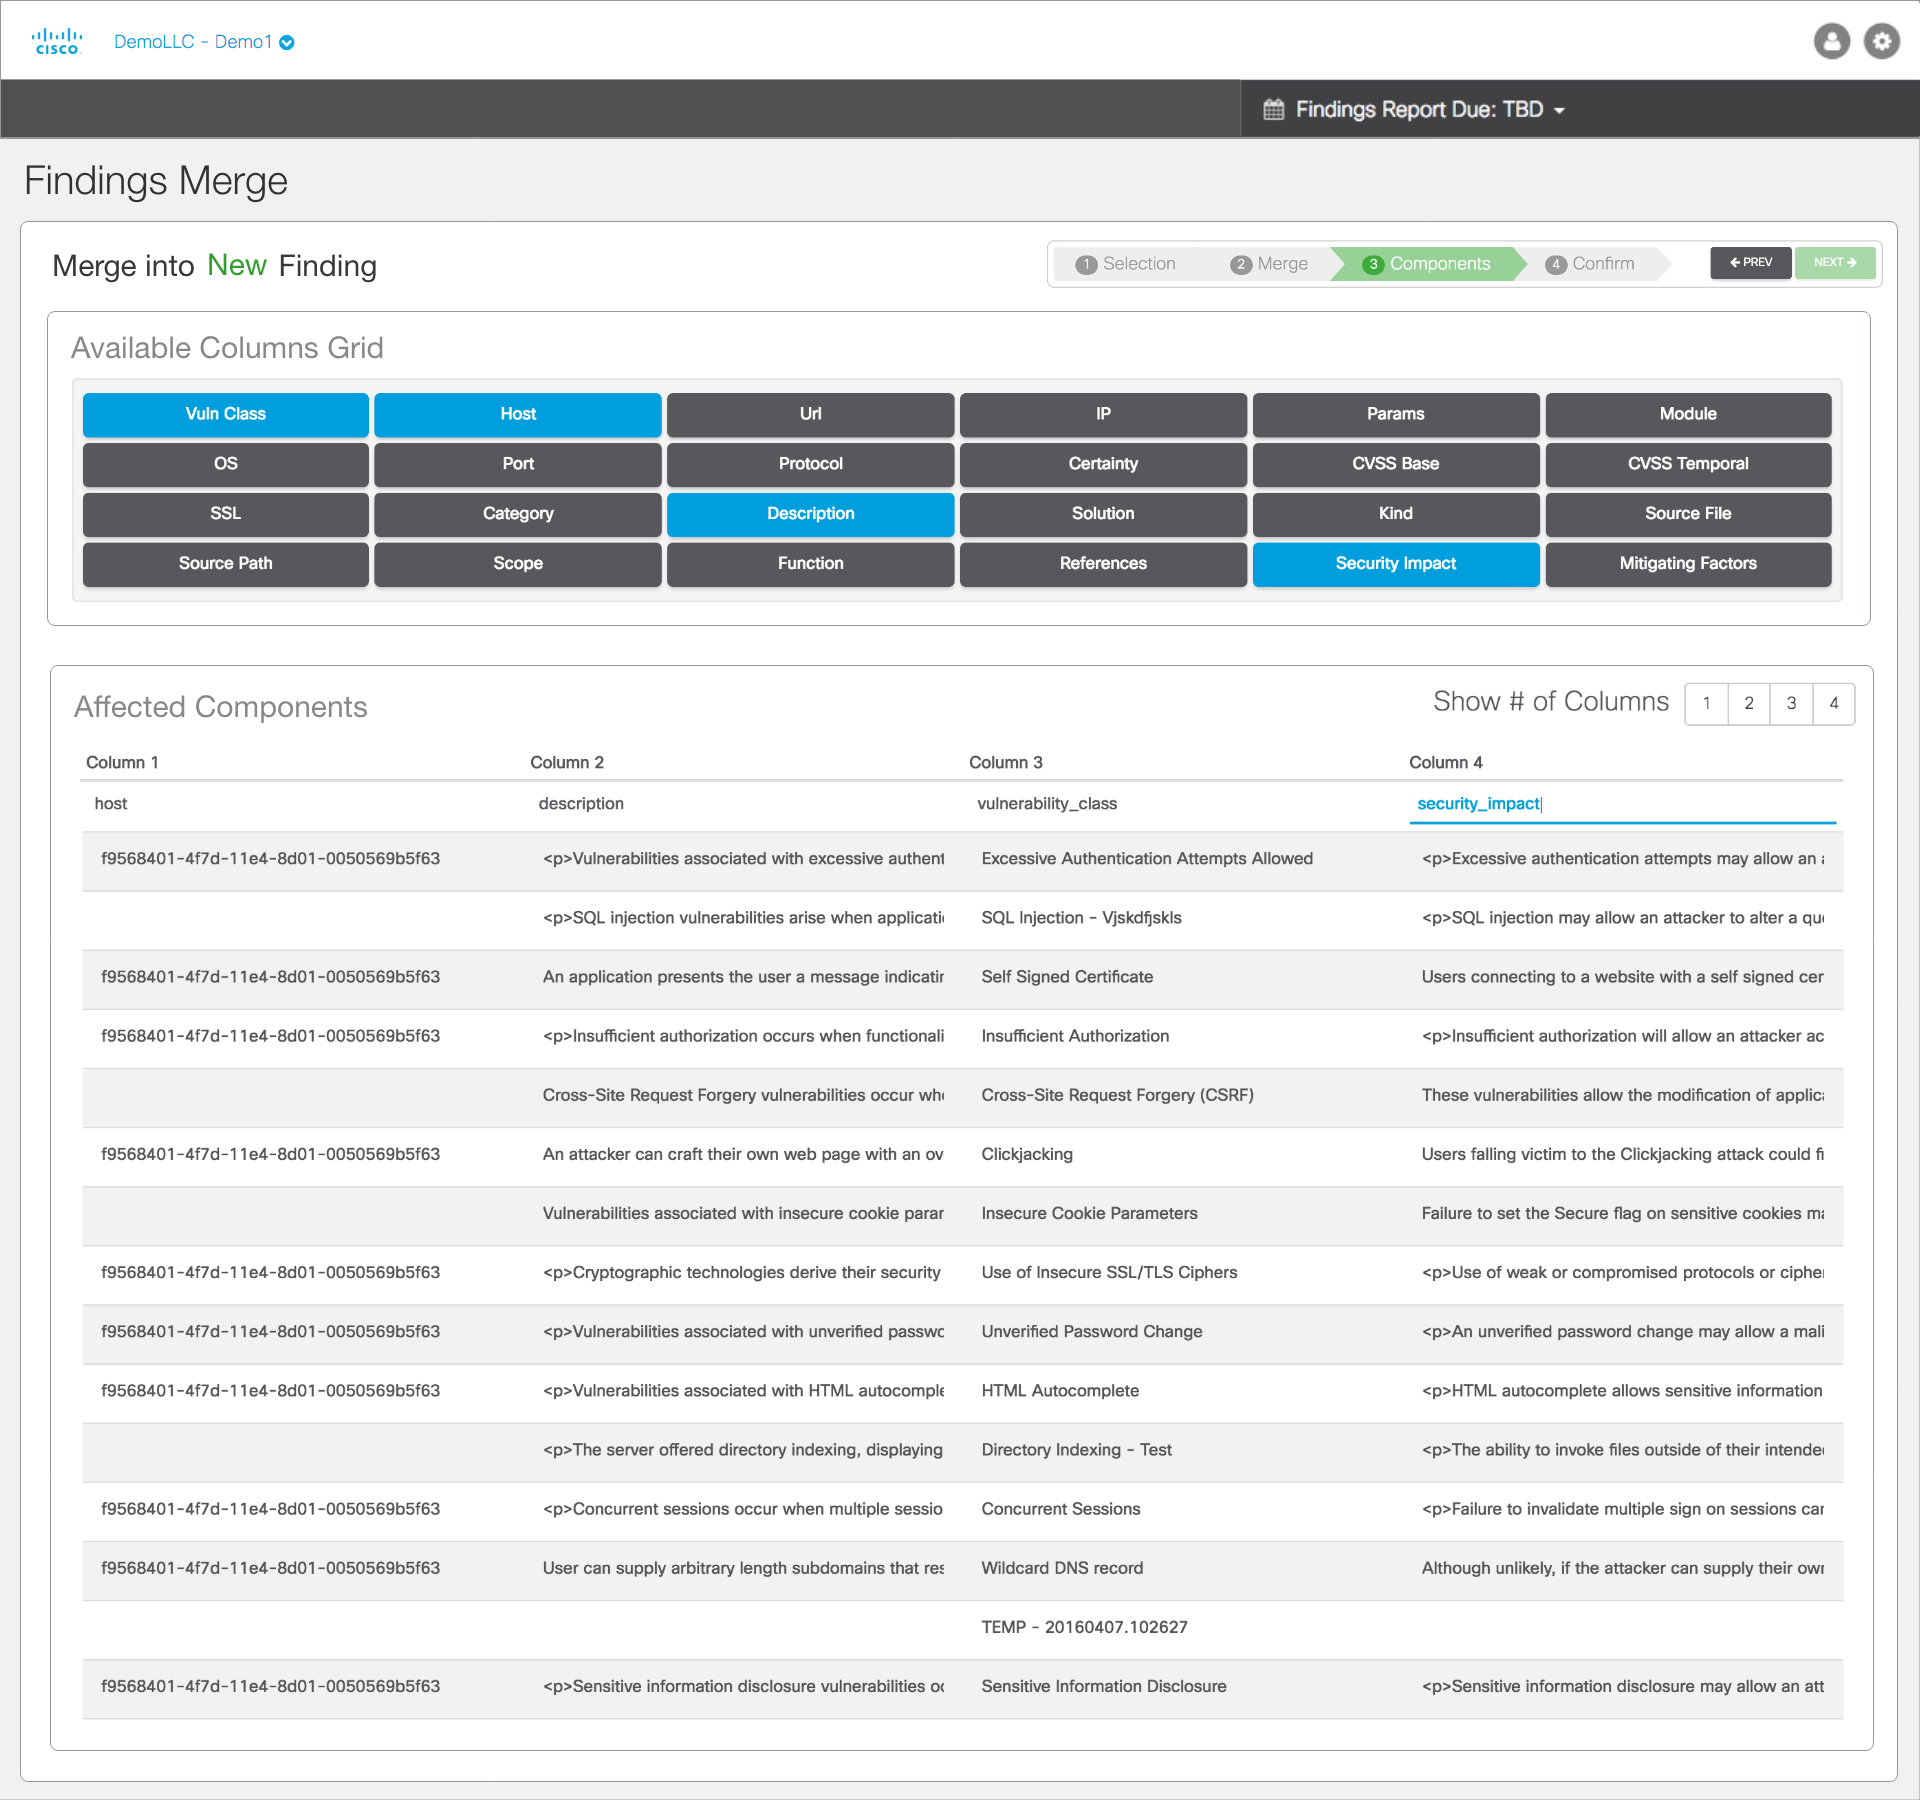
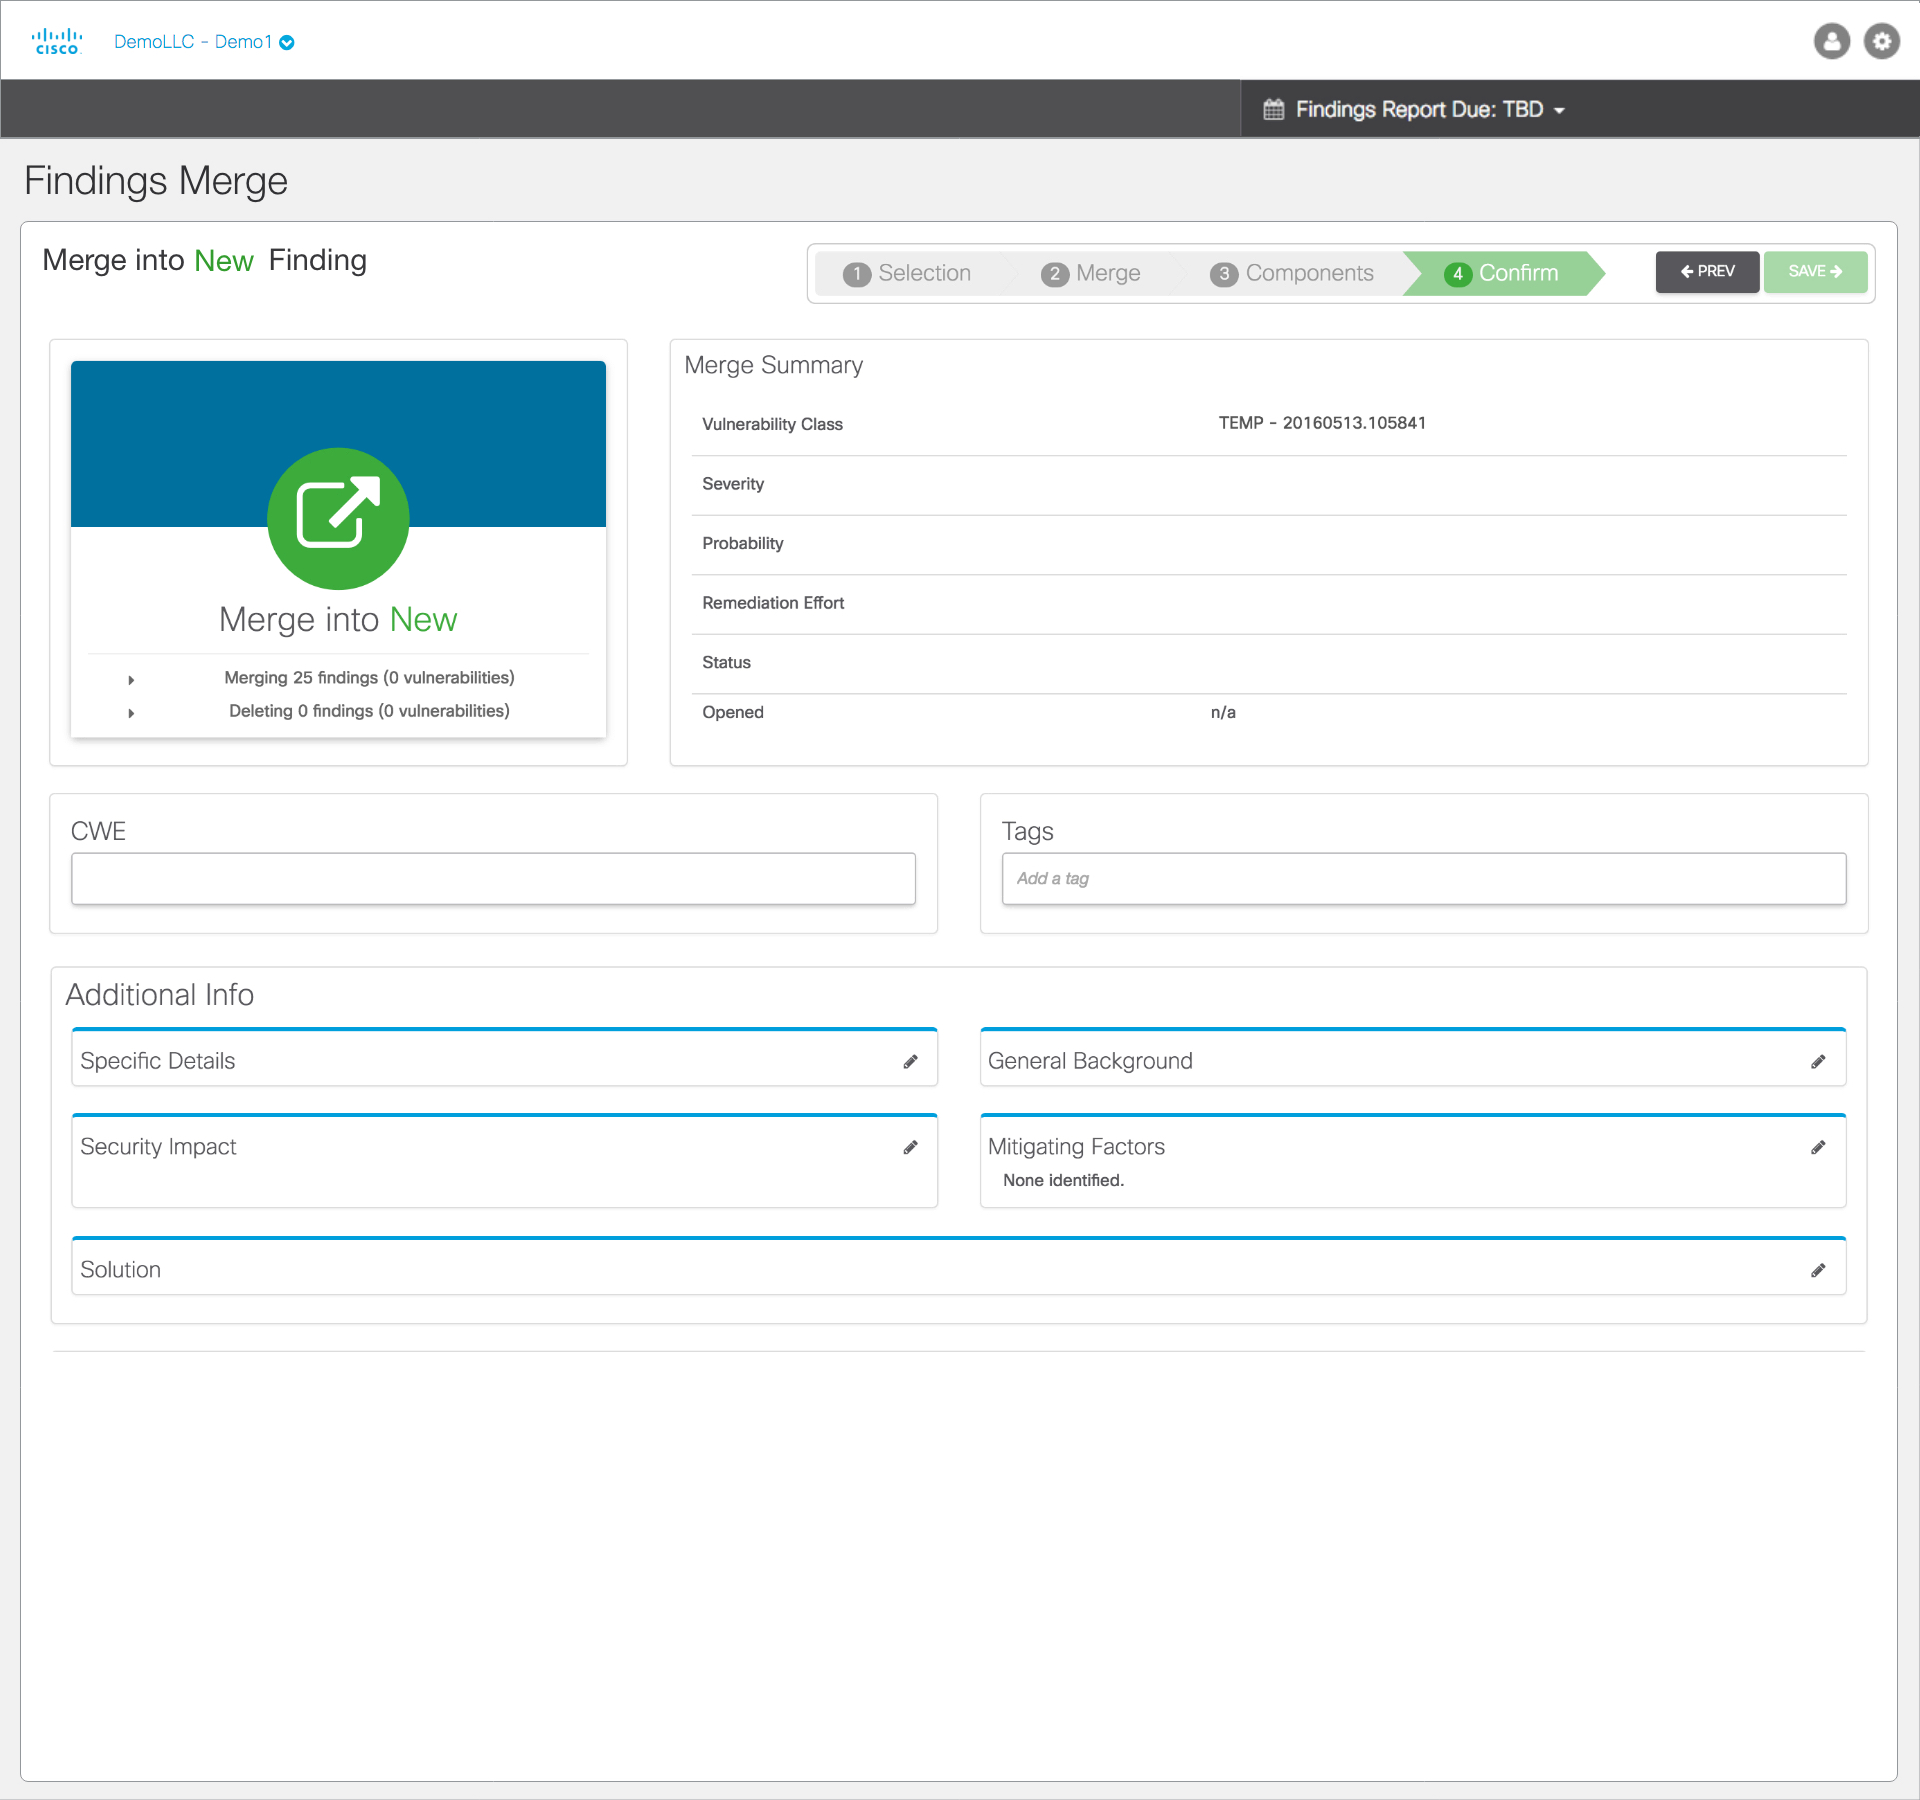
Consultants were copying scanner output into report findings by hand. I designed four explicit steps: select raw findings, choose the merge strategy, select the components to carry forward and review before saving. The sequence made a complex transformation understandable without requiring the consultant to retype the source data.
The consequential decisions
Three design decisions, carried through implementation.
01
Organize the interface around responsibility.
I retained the legacy data model and changed the information each role saw. This supported clearer task ownership while preserving existing engagements.
- Finding
- Consultants worked around a dense shared status model.
- Tradeoff
- Preserve legacy engagement data while changing the information each role sees.
- Evidence
- Journey diagrams organized by role, annotated wireframes and prototypes of the consultant view are shown in this case.
02
Start with the costly manual interaction
I focused the MVP on Findings Merge, where repeated manual entry created a clear opportunity to improve the consultant’s workflow. The guided sequence made the choices and final review explicit.
- Finding
- Consultants manually entered scanner findings into reports.
- Tradeoff
- Prioritize a focused merge workflow before addressing every surrounding screen.
- Evidence
- The Findings Merge interaction with four steps makes selection, strategy, components and confirmation explicit.
03
Carry the interaction into the working application.
I built the front-end views alongside the development team, connecting the prototype’s hierarchy and behavior to implementation.
- Finding
- The prototype needed to work within the existing application.
- Tradeoff
- Build the front-end views alongside the development team to carry the interaction into implementation.
- Evidence
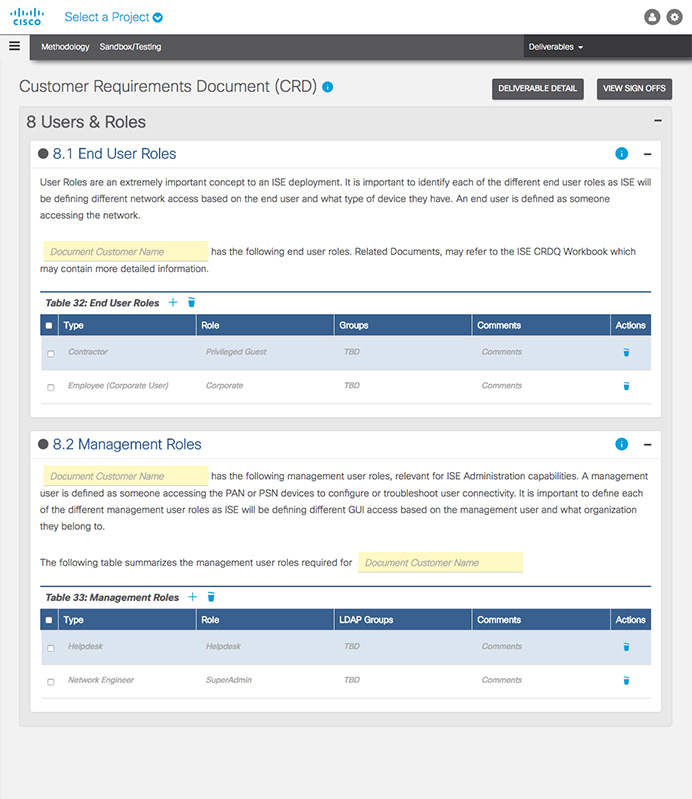
- Implemented delivery, reporting and requirements views are shown below.
Think, design, deliver, repeat
Keep research, design and implementation connected.
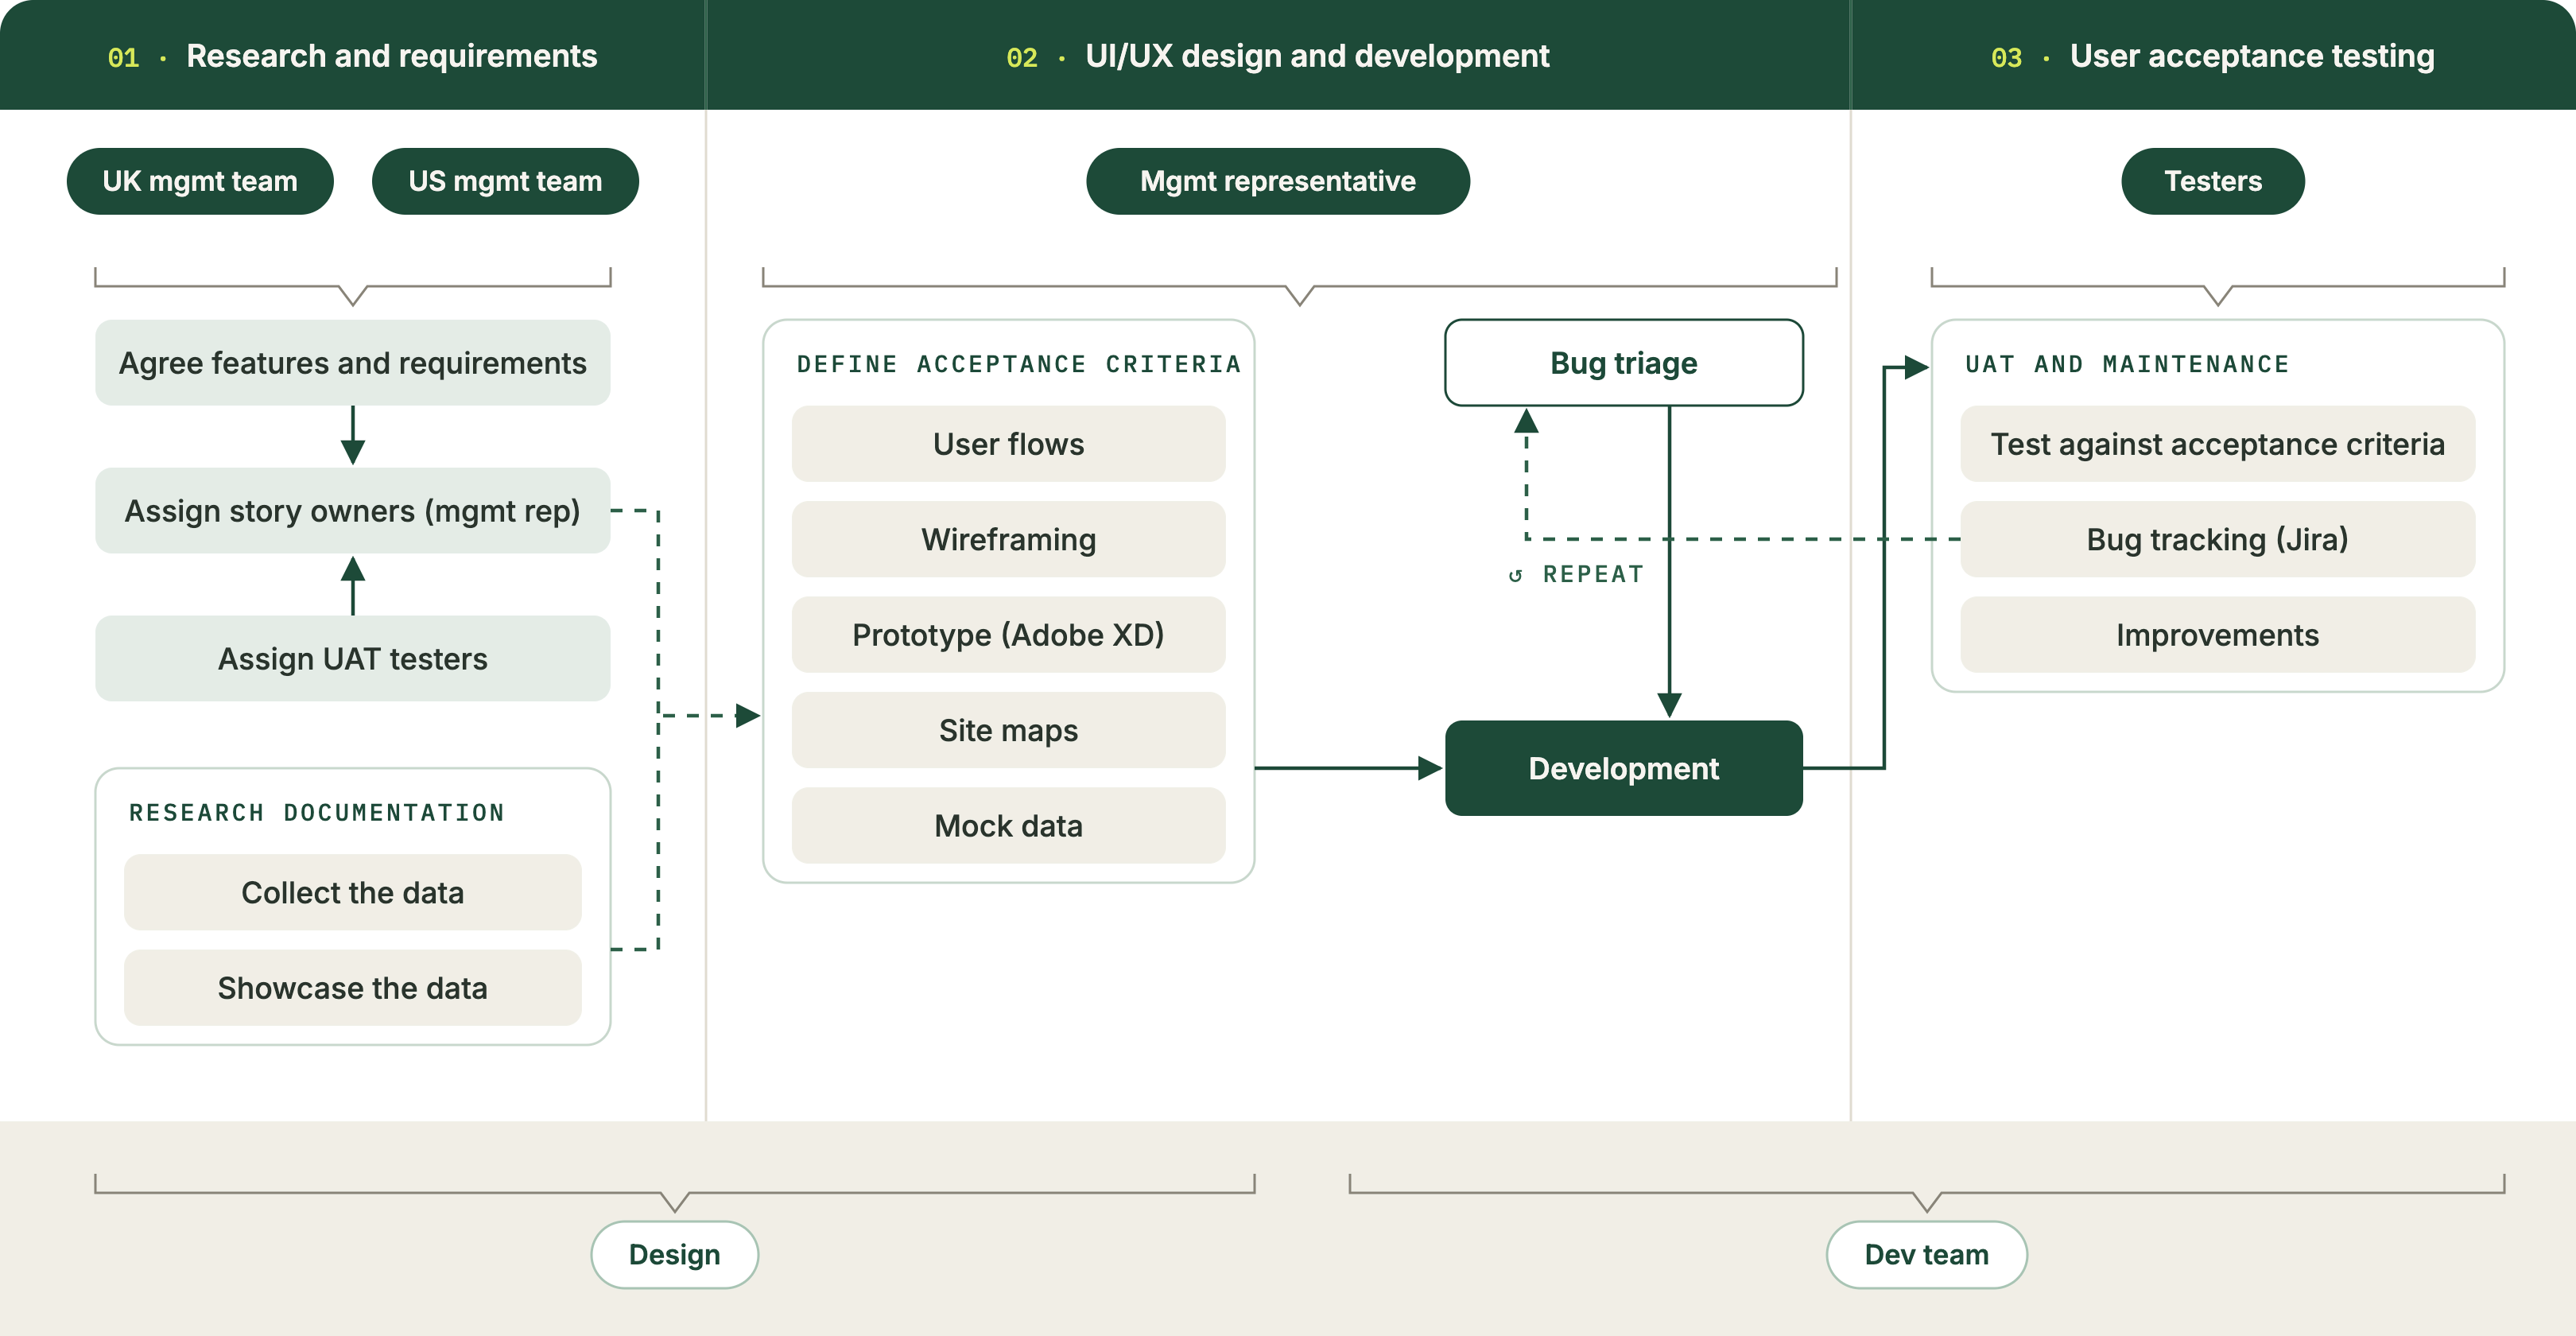
I worked with UK and US leads to align requirements, then carried designs into development and testing. Shared acceptance criteria gave both teams a consistent way to review the behavior; Jira feedback fed the next iteration.
MY ROLE
✓User research
✓Information architecture
✓Interaction design
✓Prototyping
✓Usability testing
✓Front end implementation
TOOLS
Sketch
Jira
Confluence
front-end
Slack
The result
Shared information, tailored to each role.
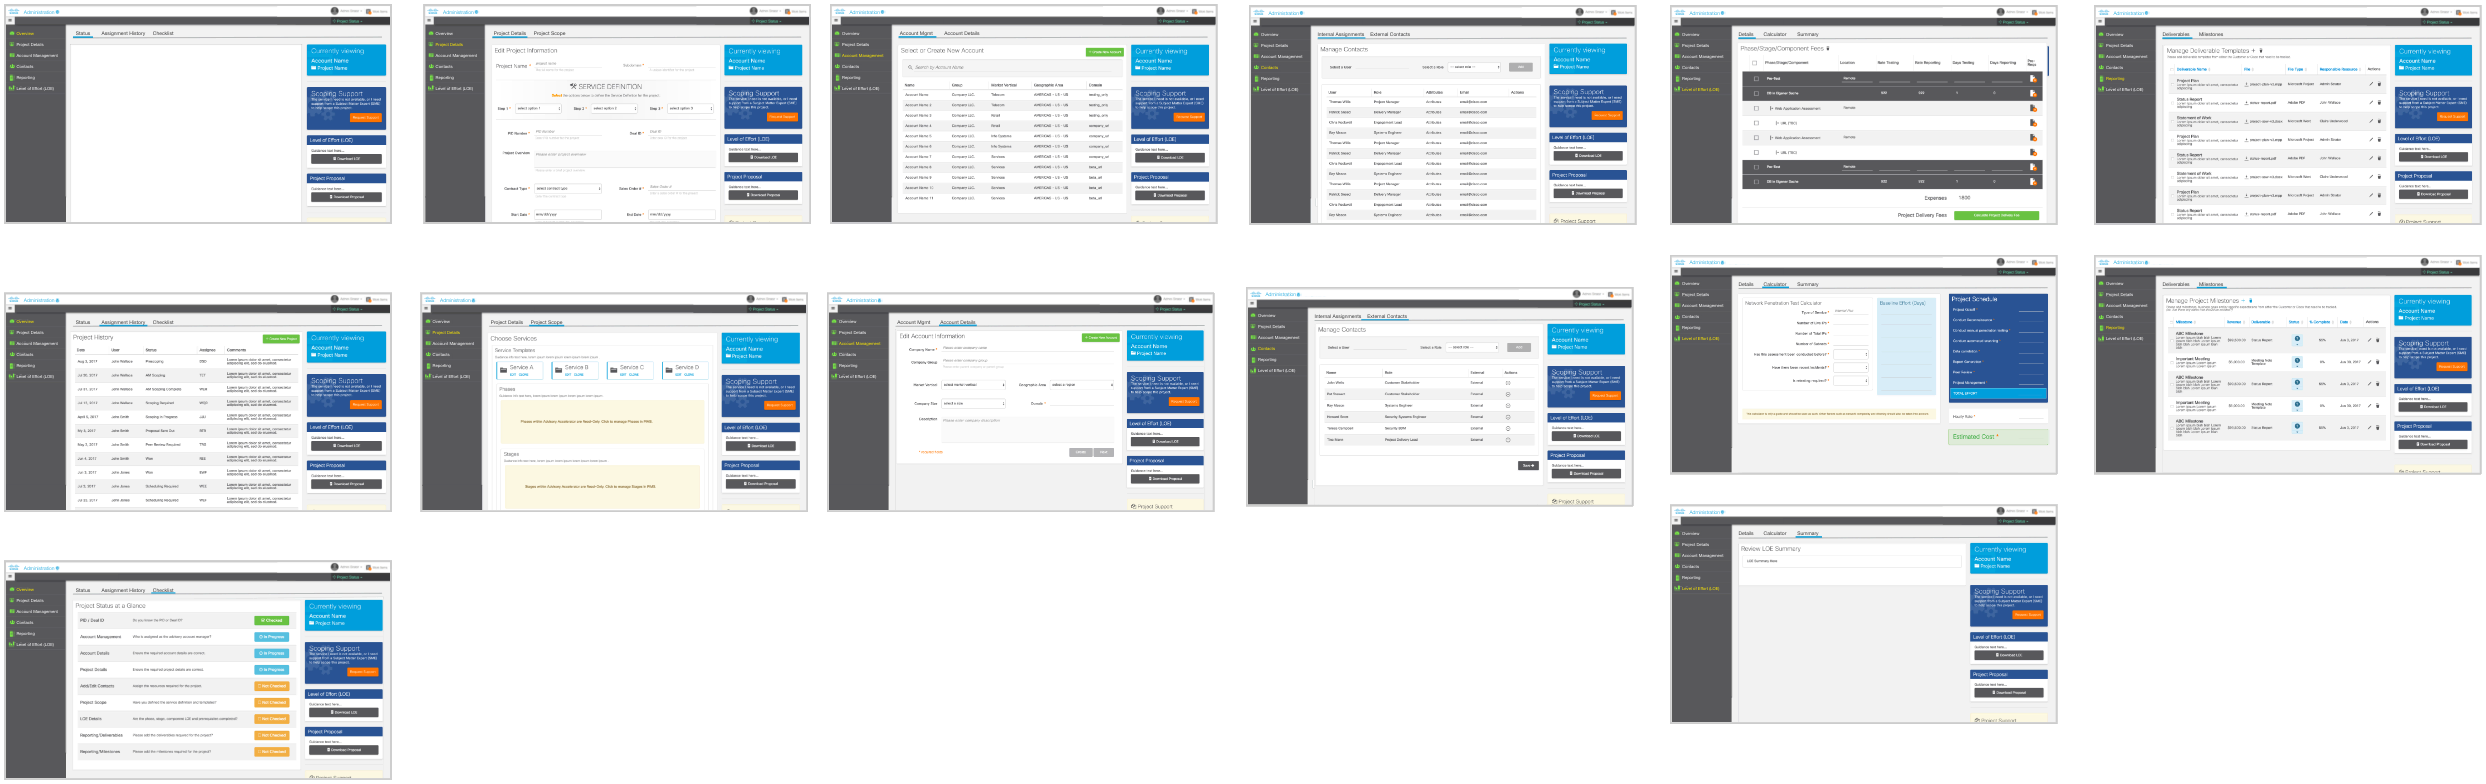
I designed and implemented the delivery, reporting and customer requirements views in JS. Together with the journeys organized by role and Findings Merge, the deliverables made the engagement lifecycle more coherent across the combined consulting teams.
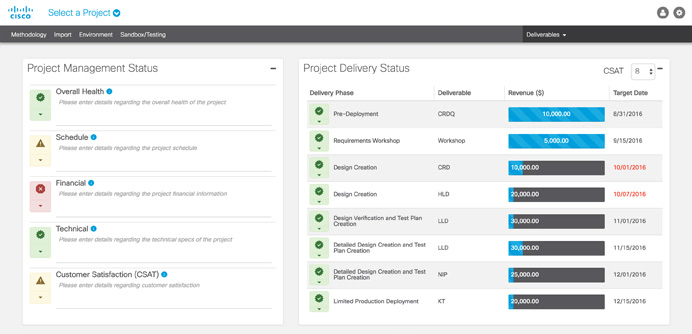
01 · DELIVERY STATUS
Project health at a glance
Health and delivery status for every engagement, with revenue broken out by phase.
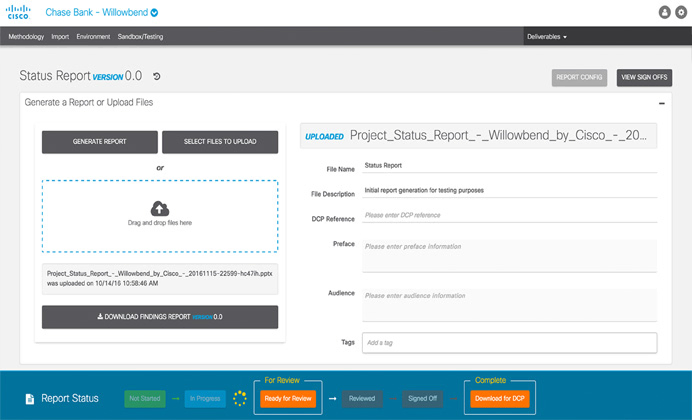
02 · STATUS REPORTS
Reports with a visible approval path
Generate or upload, then follow each report from In Progress to Signed Off.
03 · REQUIREMENTS
Customer requirements, structured
Requirement documents became editable tables instead of static files.
Scoping and delivery screens
The full set of scoping, account, and screens for estimating effort designed for the MVP.
From research artifacts to implemented views.
The whiteboards show how consultant interviews and stakeholder sessions informed the workflow. Journey diagrams and annotated wireframes document the structure organized by role; prototypes of the consultant view were tested before visual design. The implemented screens show how I carried those decisions into the front end. The next question I would measure is how task completion and repeat entry change across roles.
C.Price
MBA·PMP
UX/UI Design · Design Systems · Accessibility
© 2026 C.Price
Atlanta, GA (metro)